Bayesian Pplot
This module provides the functionality to generate a posterior plot for the Bayesian optimization results. The following code snippet demonstrates how to generate a posterior plot of the results of the experiments:
from SAES.plots.pplot import Pplot
# Load the data and metrics from the CSV files
data = "swarmIntelligence.csv"
metrics = "multiobjectiveMetrics.csv"
# Show the boxplot instead of saving it on disk
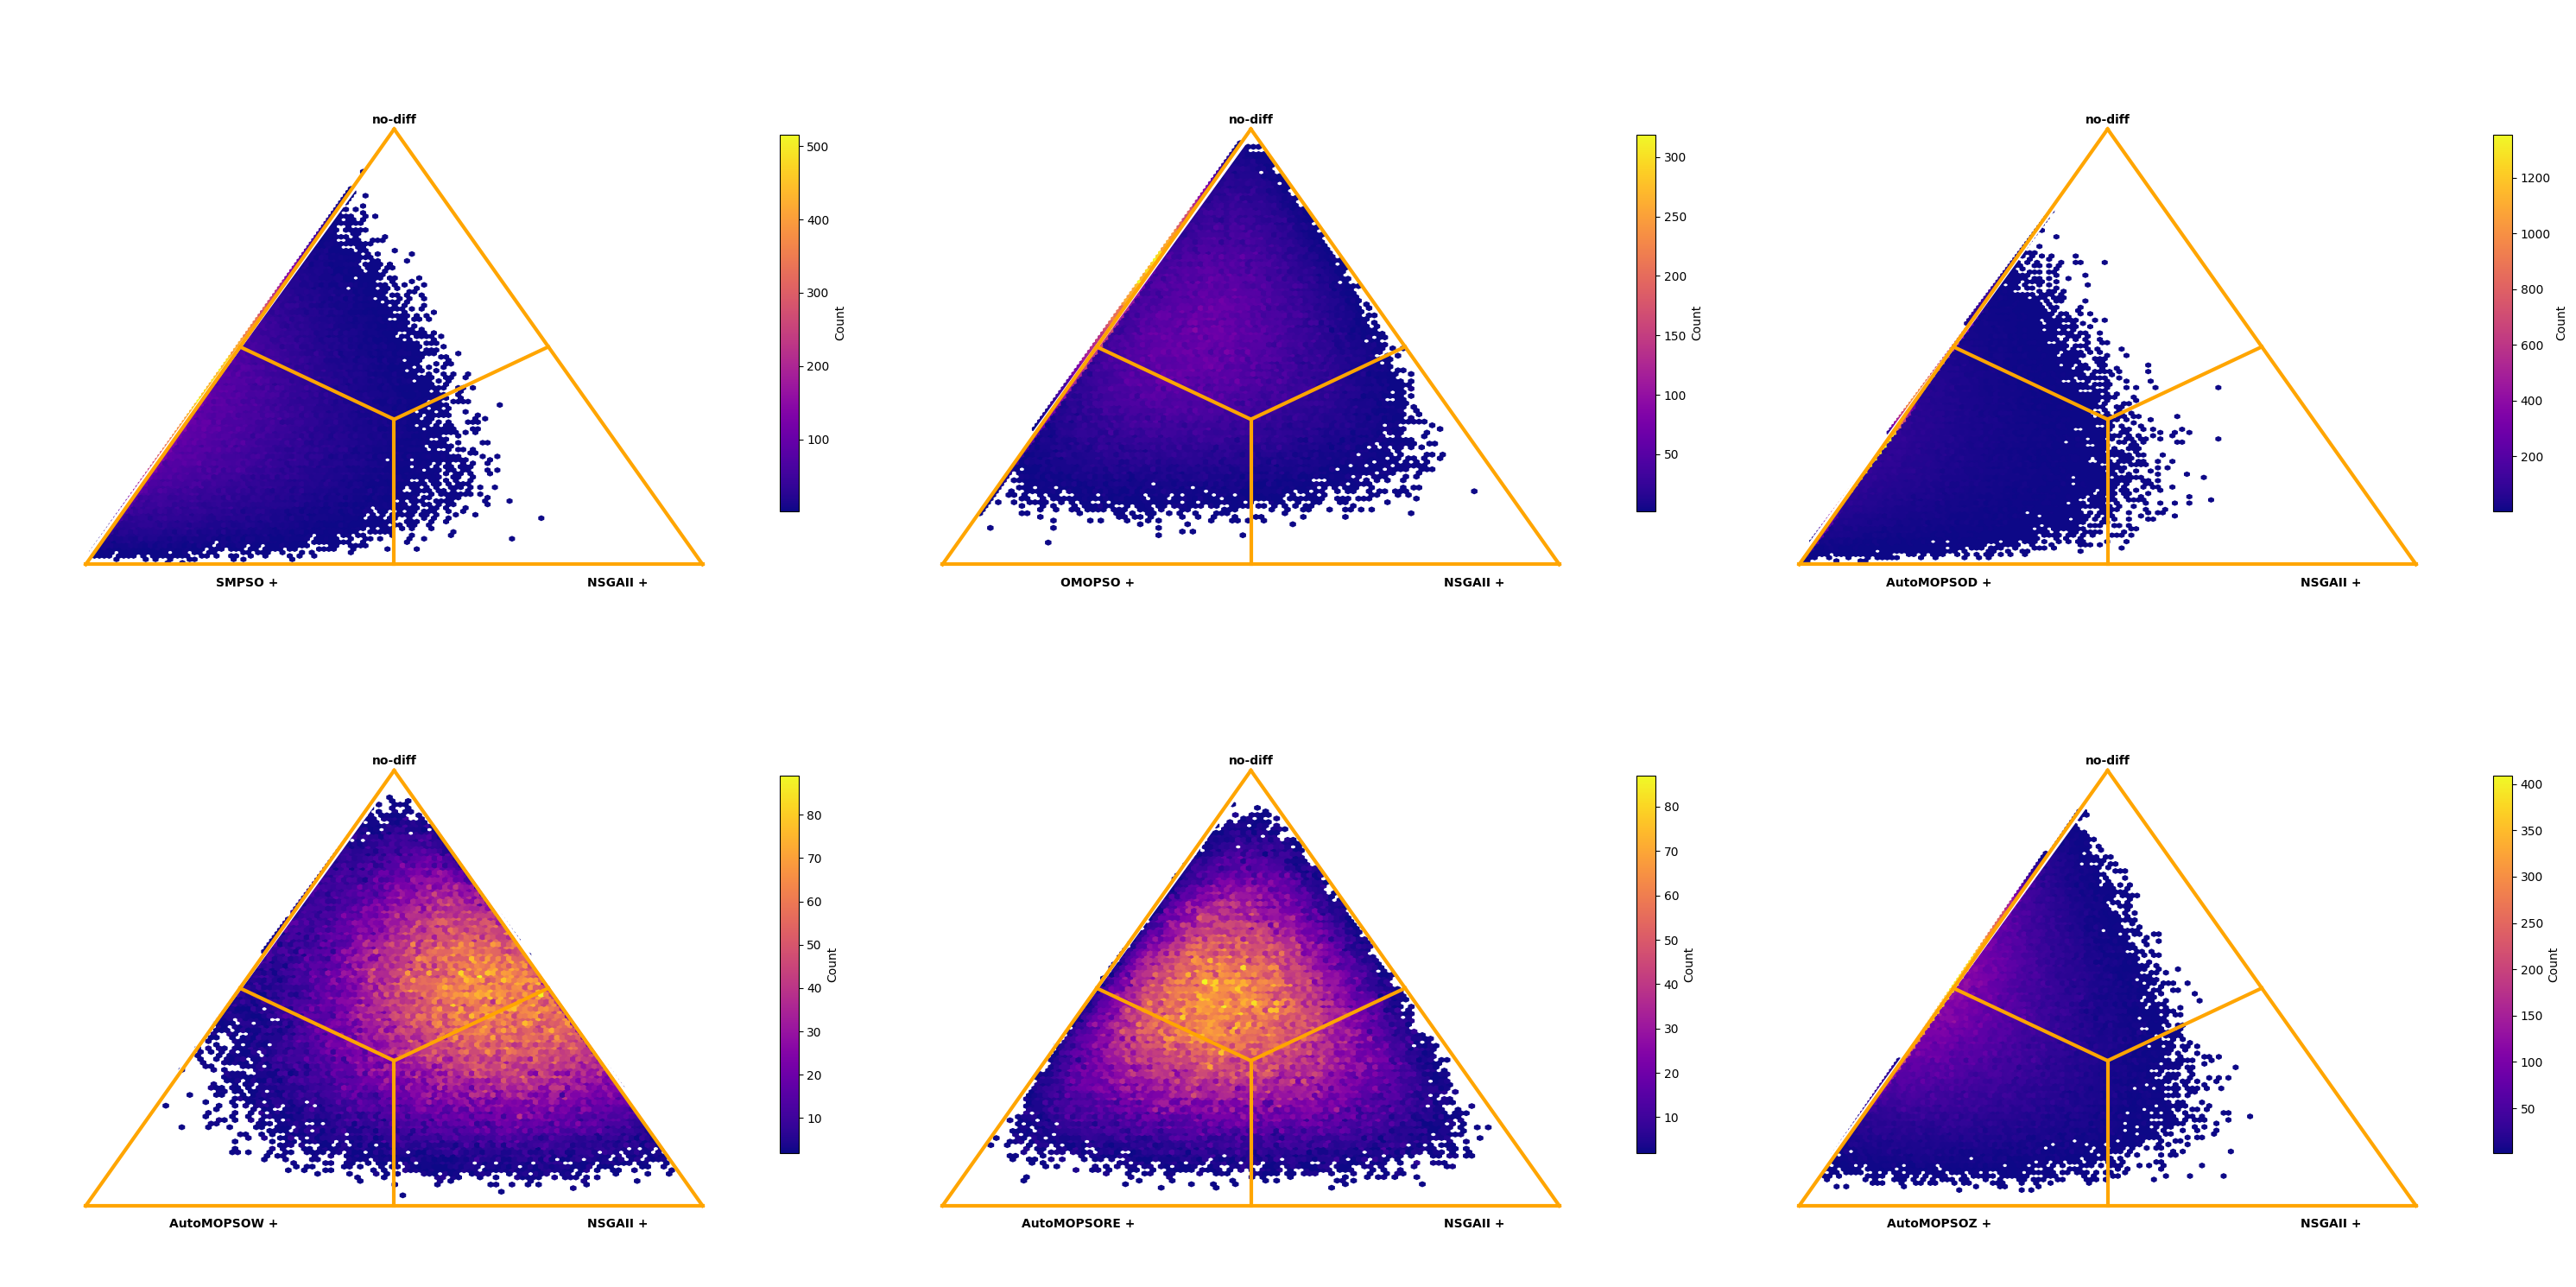
pplot = Pplot(experimentData, metrics, "NHV")
pplot.show_pivot("NSGAII", width=30, heigth=15)
The above code snippet generates a bayesian Pplot comparing experimental results of the NSGAII algorithm with the rest of the algorithms in the data using NHV as the metric. The width and heigth parameters are optional and can be used to adjust the size of the plot. The following image shows an example of a Bayesian Pplot generated using the above code snippet: