Critical Distance Graph
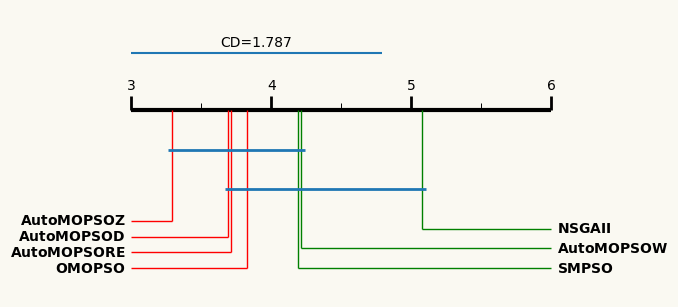
The last feauture of the library is the ability to generate critical distance graphs of the results of the experiments. The following code snippet demonstrates how to generate a critical distance diagram of the results of the experiments for a selected metric:
from SAES.plots.cdplot import CDplot

# Load the data and metrics from the CSV files
data = "swarmIntelligence.csv"
metrics = "multiobjectiveMetrics.csv"

# Save the critical distance plot on disk instead of displaying it
cdplot = CDplot(data, metrics, "NHV")
cdplot.save("./output/")
The above code snippet generates a critical distance diagram for the experimental results of all problems based on the selected metric “NHV.” The critical distance diagram is saved as a PNG file in the current working directory because we are using the save() function, and it will look similar to this: