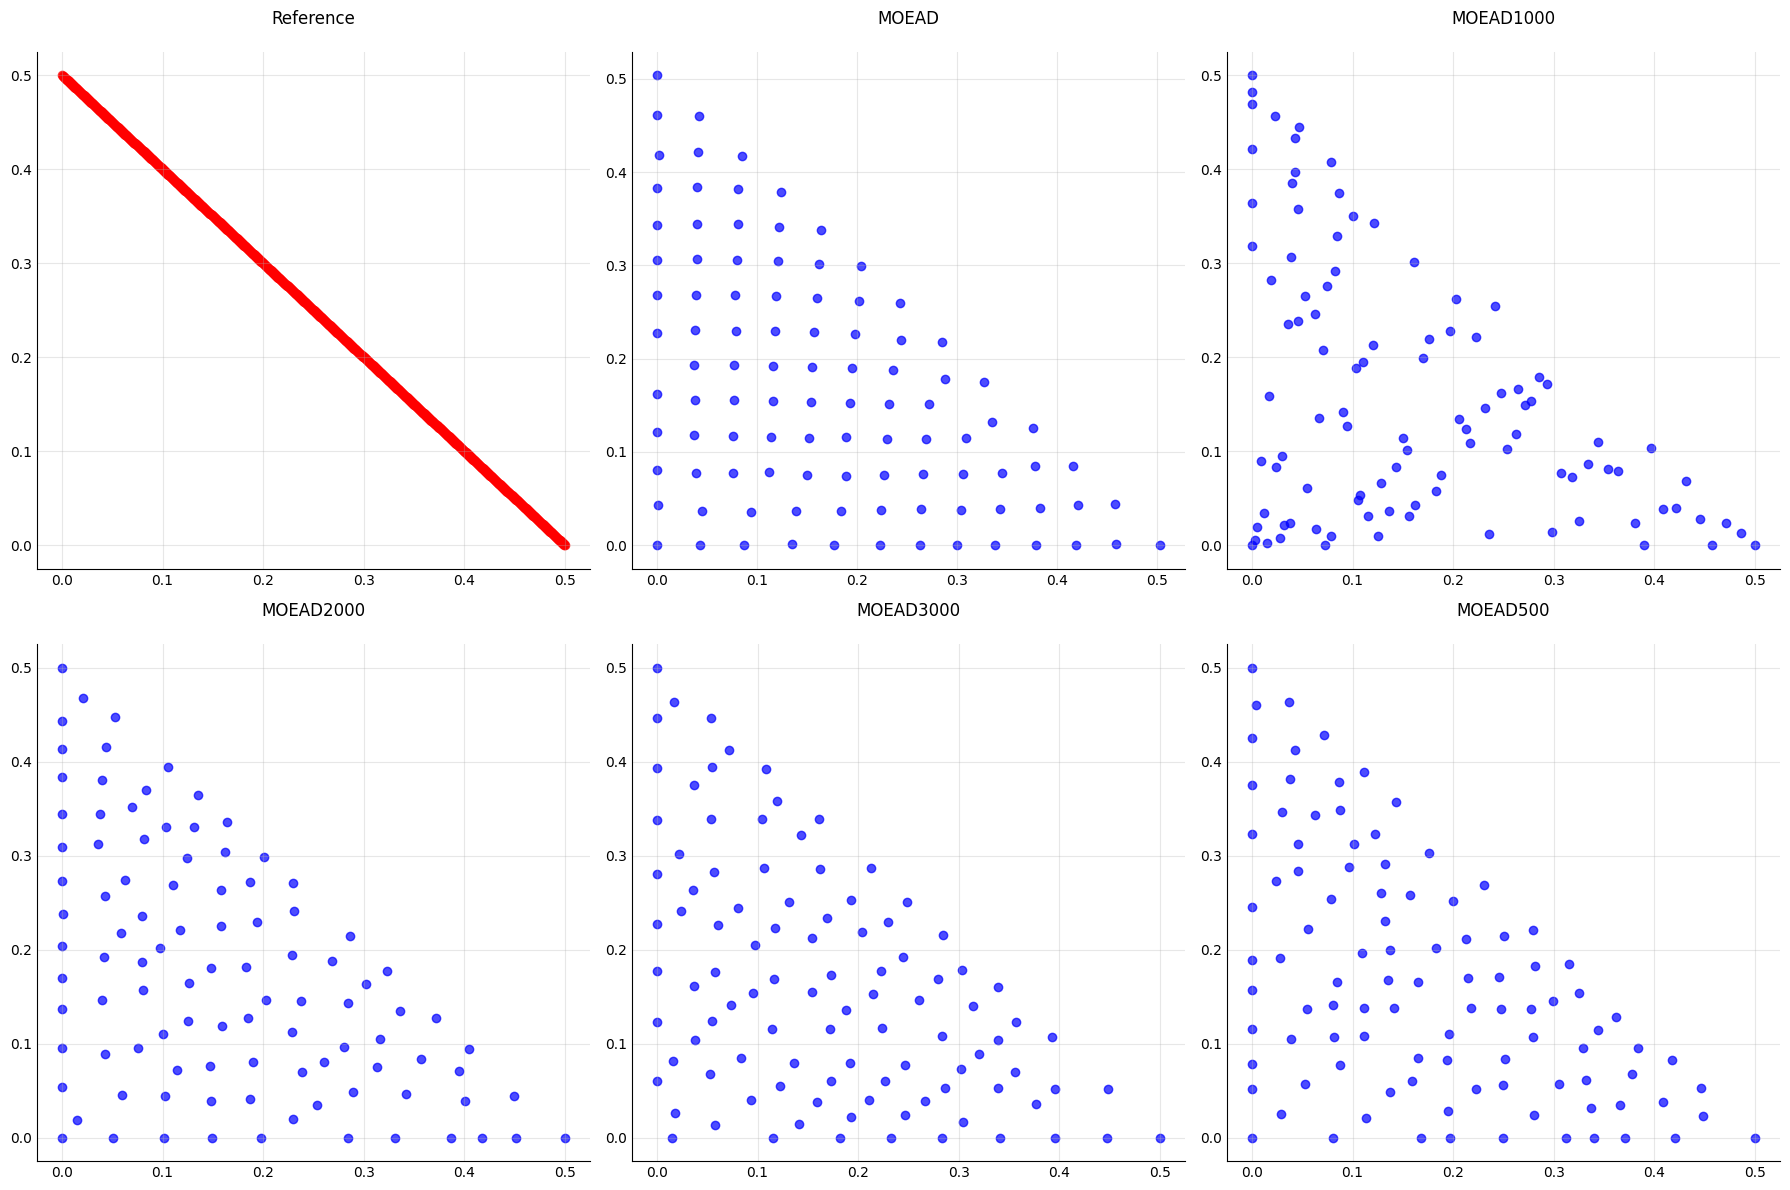
Fronts 2D
The most simple way to visualize the results of the experiments is by plotting the pareto front in 2D. The following code snippet demonstrates how to generate a 2D plot of the results of the experiments:
from SAES.multiobjective.pareto_front import Front2D

# Load the data and metrics from the CSV files
fronts_path = "fronts"
references_path = "references"

# Show the boxplot instead of saving it on disk
front = Front2D(fronts_path, references_path, metric)
boxplot = Boxplot(experimentData, metrics, "NHV")
front.show("WFG9", median=True)
The above code snippet generates a boxplot for the experimental results of the selected problem “WFG9” and the selected metric “NHV.” The plot is not saved in disk and it is just displayed because we are using the show() function. The boxplot should look something similar to this: